Ontario Organic Data and Statistics
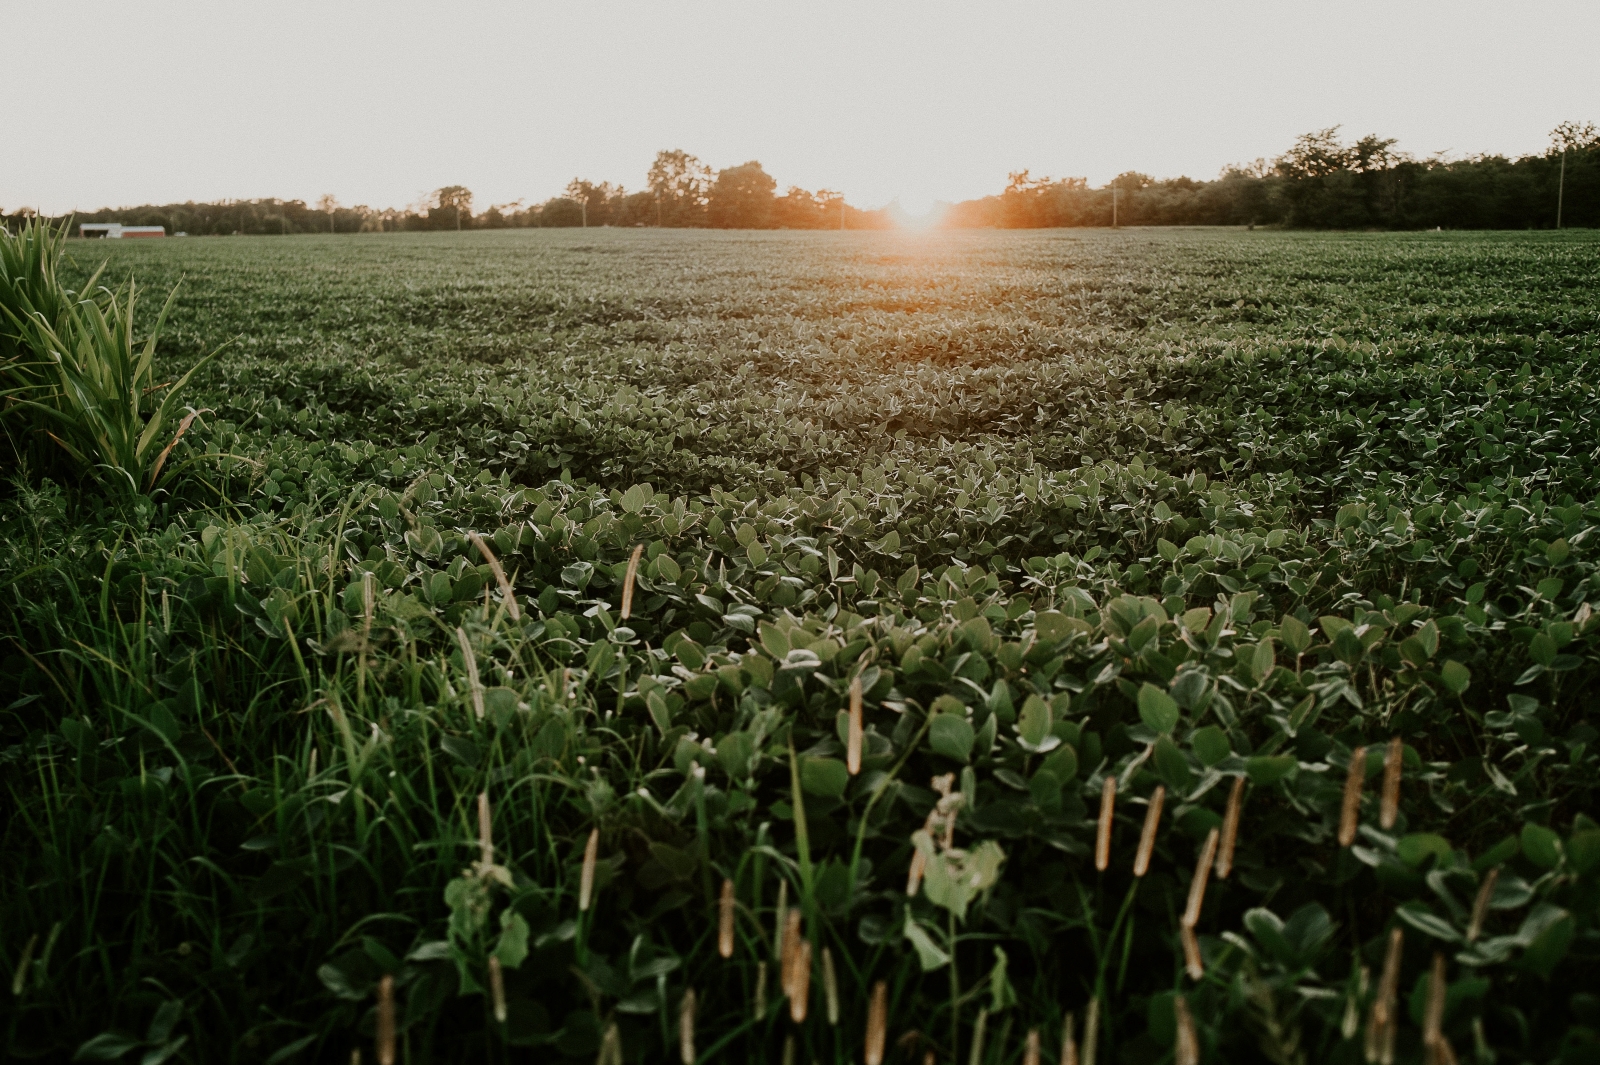
Cost of Production for Organic Dairy
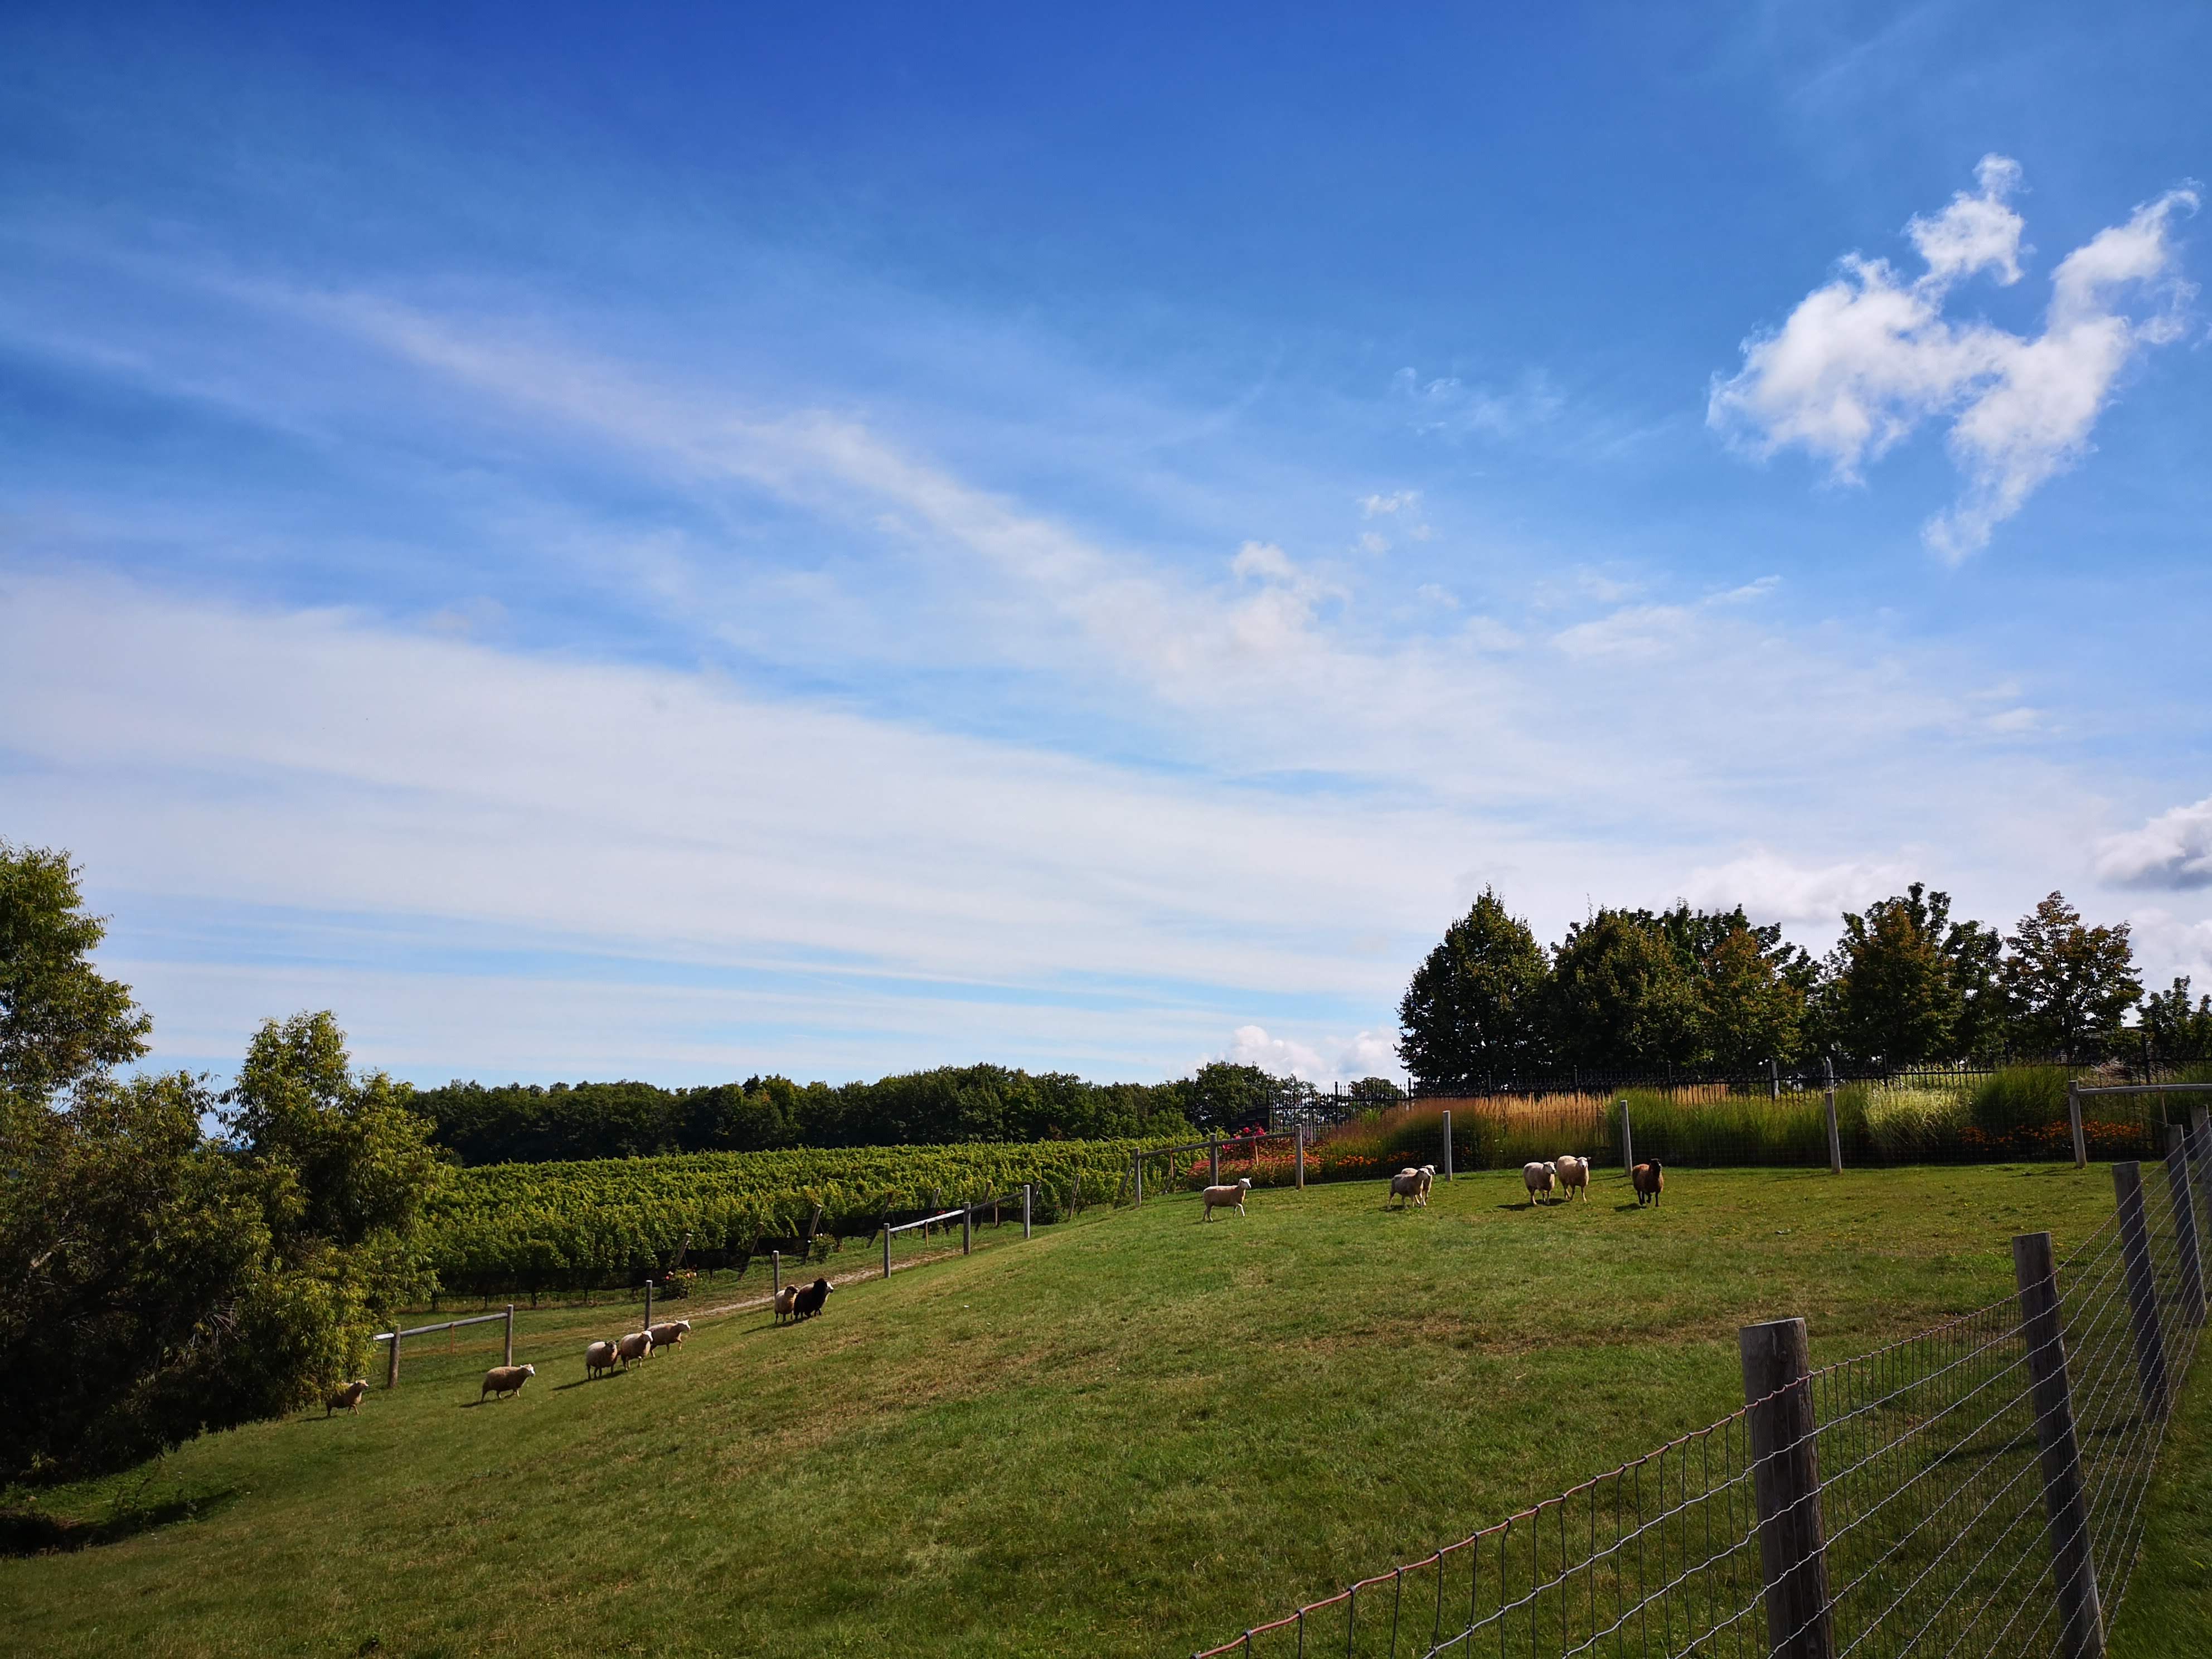
This document is part of the 2020 series of organic cost of production (COP) models prepared by the Organic Council of Ontario. This particular model focuses on organic dairy production based on financial data from 2018.
The primary objectives of this COP model are to assist:
- New entrants to the organic dairy industry;
- Conventional farmers in considering the decision to adopt some organic production methods and even engage in the transition to certified organic production by understanding the organic COP and profitability;
- Organic farmers in the management of their own production costs and to benchmark their results to average industry performance.
.png)
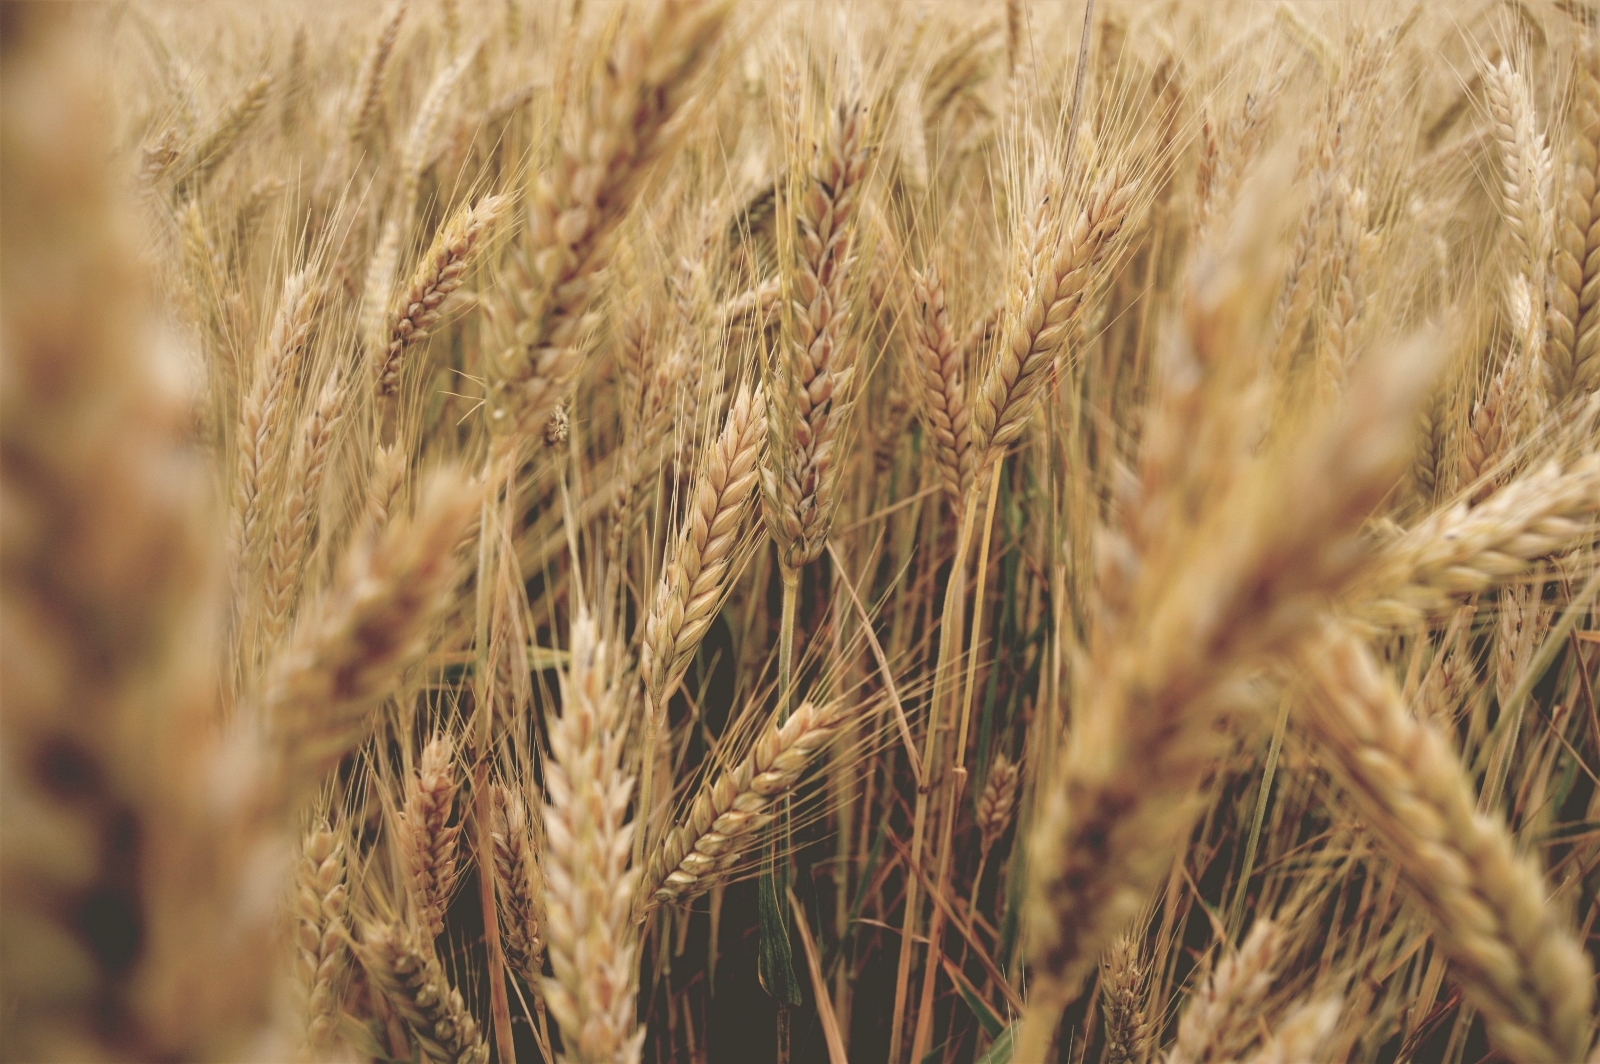
Cost of Production for Organic Field Crops
This document is part of the 2020 series of organic cost of production (COP) models prepared by the Organic Council of Ontario. This particular model focuses on organic field crops and a three year crop rotation of corn, soybeans, and wheat. This document is accompanied by the Budget spreadsheet.
The primary objectives of this COP model are to assist:
- conventional farmers interested in adopting some organic production methods or potentially in transitioning to certified organic production in order to gain an understanding of the organic COP and profitability.
- organic farmers in order to:
- understand where they are spending their money
- determine what the profitability of their crops is and could be
- benchmark their farm against the published COP model
- strive to meet or exceed the published COP’s yield and profit potential
.png)
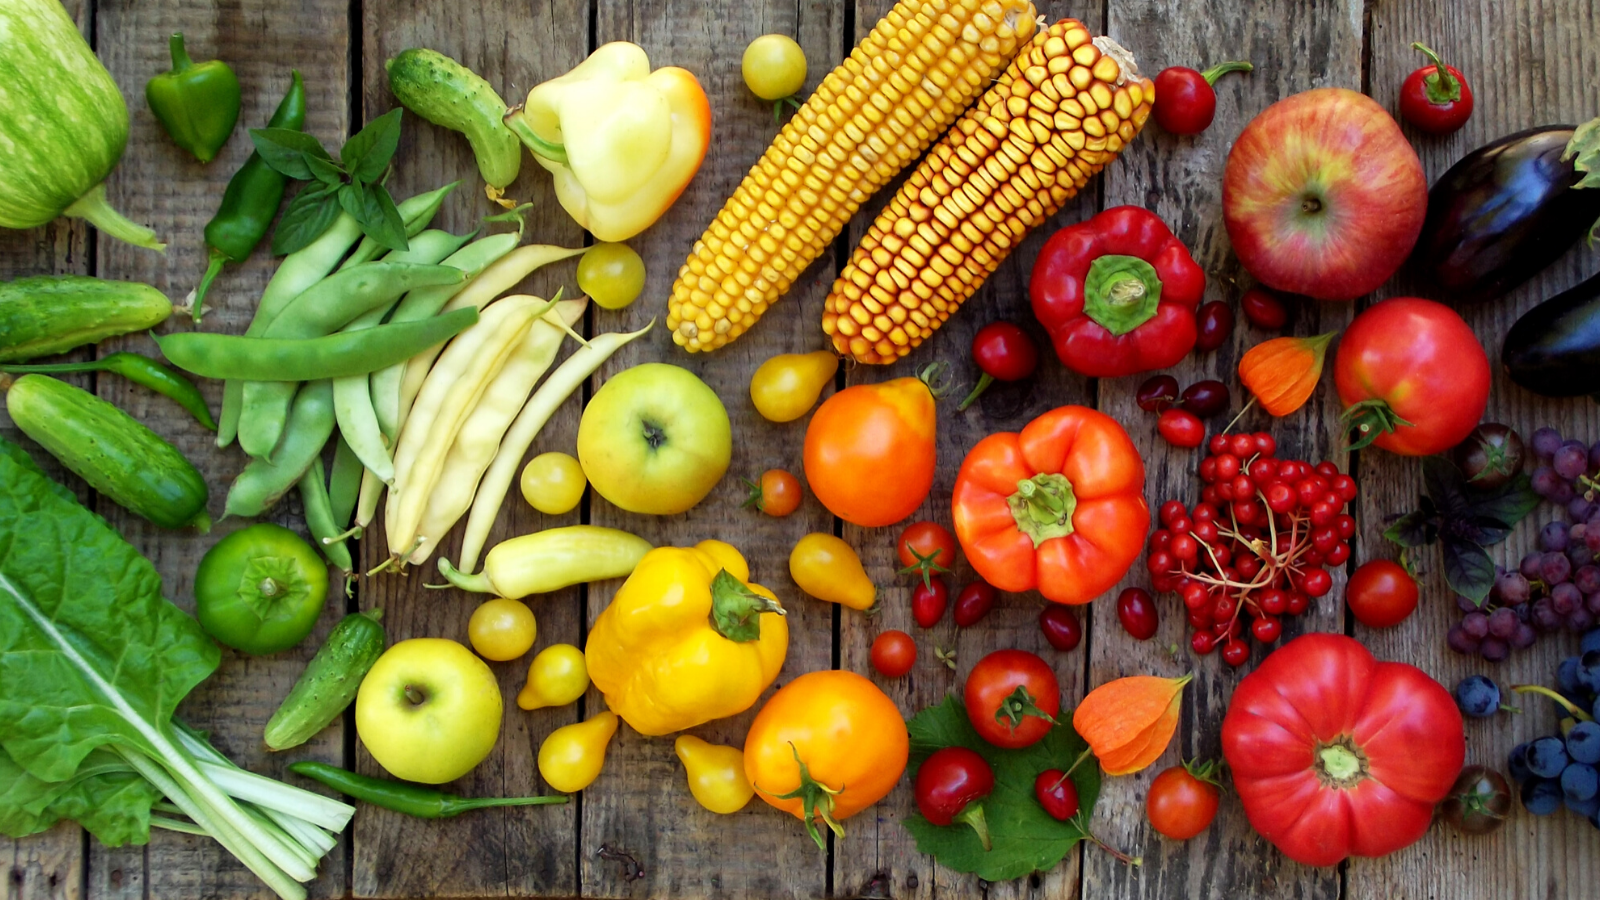
Cost of Production for Organic Salad Greens
This document is part of the 2020 series of organic cost of production (COP) models prepared by the Organic Council of Ontario. This particular model focuses on the organic production of salad greens based on financial data from 2018.
This resource enables a producer from a working market garden to use budget figures to determine their approximate full Costs of Production (COP) for organic salad greens. This can be used by either large or small-scale growers, for seasonal outdoor production, with or without season-extension hoop-houses, and/or year-round greenhouse production which includes microgreens. It could also be modified to work for additional market garden vegetables. The results can serve as a valuable guide for business decision-making, and understanding elements of profitability.
.png)
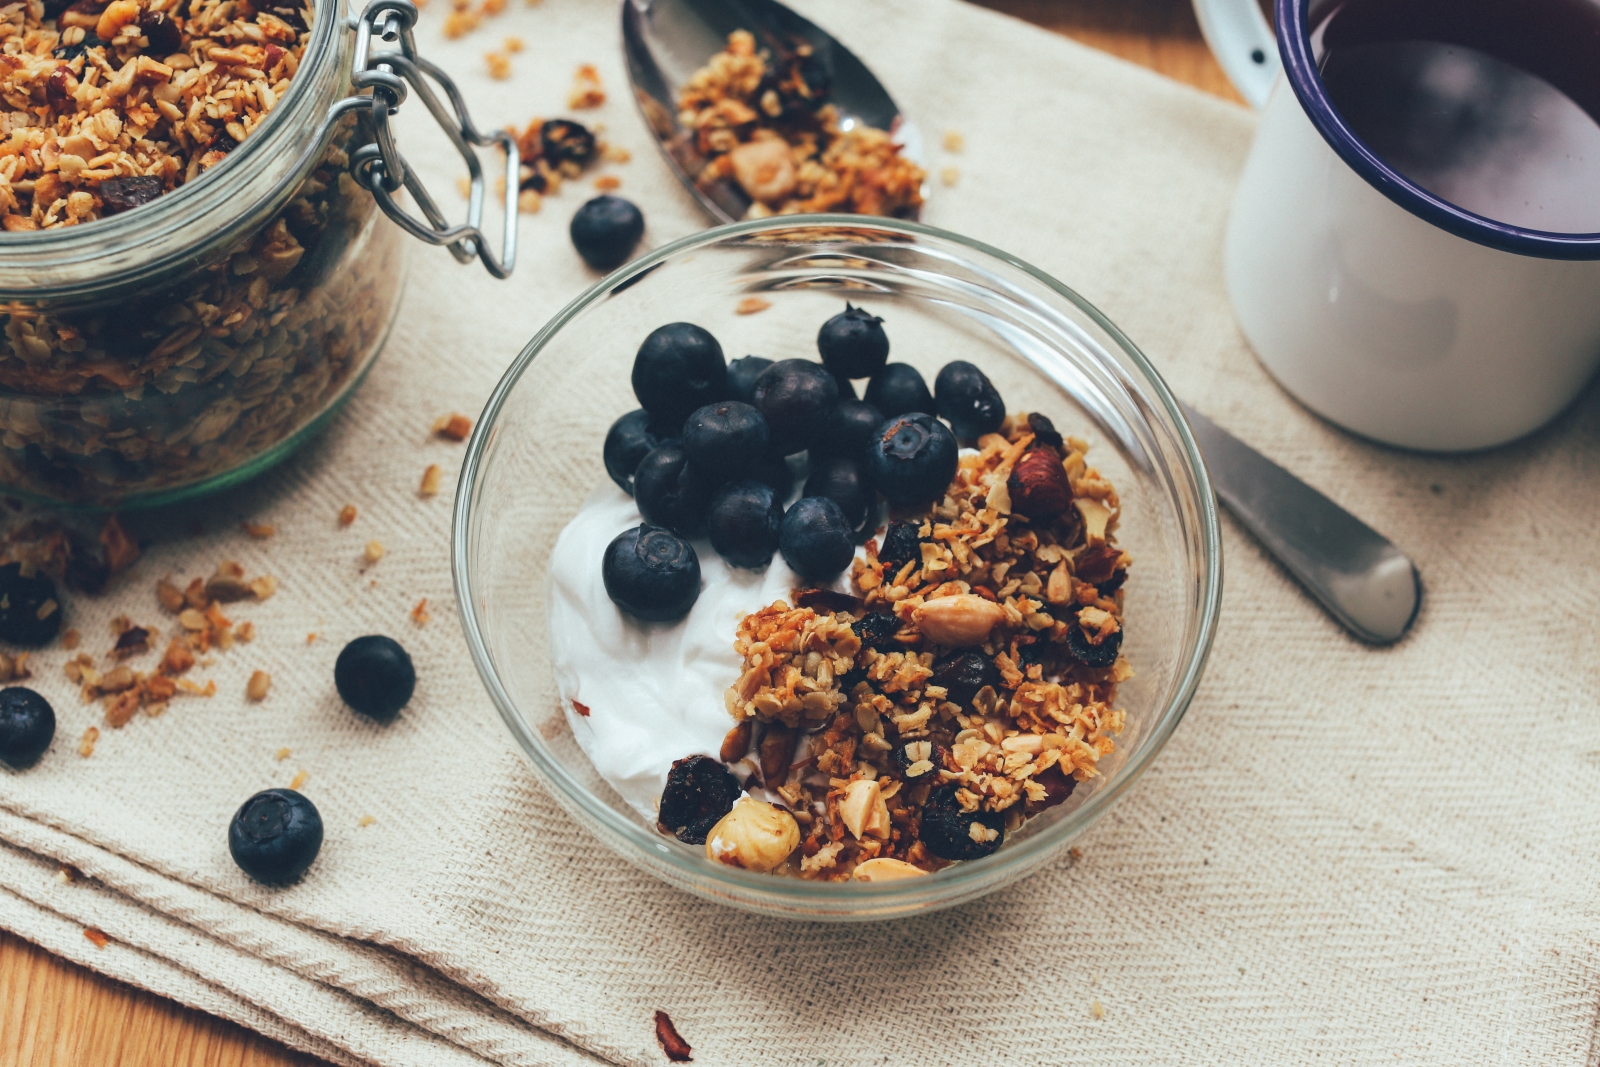
Cost of Production for Pastured Organic Poultry
This document is part of the 2020 series of organic cost of production (COP) models prepared by the Organic Council of Ontario. This particular model focuses on the organic production of pastured poultry, specifically pastured chickens, and is based on financial data from 2018. This COP model can be adapted to determine COP for other pastured poultry production such as turkeys or ducks, however the average cost benchmarks listed in the budget are for chicken production specifically.
The objectives of this study are to:
- assist new entrants to the organic livestock industry
- inform conventional farmers considering the transition to certified organic production
- and improve management practices of organic farmers by providing a benchmark compared to average industry performance
.png)
Food & Beverage Processing
Coming Soon
The Canadian organic food and beverage market was valued at $4.4 billion in 2017, with $2.5 billion representing processed organic food products sold at Canadian retail (Canada Organic Trade Association). Most organic food processing businesses in Canada are based in Ontario, Quebec and British Columbia, and in particular multi-ingredient food processing. In Ontario, beverage processing makes up the largest number of processors, followed by grains, snacks, dairy, and fruits and vegetables. Ontario leads the country with the most organic dairy, beverage, grain and ingredients processors. This report presents data highlights about the Ontario organic processing industry.
Fruits & Vegetables
Nationally, fruits and vegetables account for less than 3% of organic farmland in Canada. However, this category is a cornerstone of the organic market as it is the most commonly purchased category of organic foods (Canada Organic Trade Association).
In 2018, Ontario had roughly 5,900 acres of organic fruit and vegetable crops, which made up approximately 3.6% of Ontario's total organic acreage (Canada Organic Trade Association). Ontario ranks third among the provinces for total organic fruit and vegetable crop area (7.4%), behind Quebec (63%) and British Columbia (18%). In 2018, Ontario's top organic fruit crops by acreage were wine grapes and apples, and Ontario's top organic vegetable crops by acreage were tomatoes, sweet corn, and potatoes. This report provides an overview of the Ontario organic fruit and vegetable sector.
Grains & Oilseeds
Nationally, field crops account for roughly 35% of organic farmland in Canada, while forages and pasture account for approximately 62% of organic farmland. In 2018, Ontario ranked fourth among the provinces for total organic field crop area with about 7% (Canada Organic Trade Association, 2019).
In the 2016 Census of Agriculture, field crops made up approximately 78% of all Ontario cropland. Organic field crops account for approximately 1% of all field crops grown in Ontario. The three largest field crops grown in Ontario, both organic and non-organic, are soybeans, corn, and winter wheat. This report will provide an overview of the organic field crop sector, including acreage, yield, and pricing data.
Market & Consumer Data
Coming Soon
The Canadian organic retail market was valued at $5.4 billion in 2017, ranking sixth in the world (Canada Organic Trade Association). Ontario is the largest provincial market, with nearly 30% market share of Canadian organic retail sales. Ontario has experienced nearly 10% annual year-over-year growth since 2012, with estimated organic retail sales at $1.6 billion in 2017. Two-thirds of Canadians are purchasing organic products weekly. Canada’s highest weekly buyers of organic groceries are millennials (83%), university graduates (78%) and families (72%). This report will present research and data on the Ontario organic consumer and retail market.
.jpg)
Ontario Organic Agriculture Summary
Coming Soon
Ontario produces a diverse range of organic agricultural products and has been growing steadily as a sector. From 2004 to 2018, the number of organic farms in Ontario has grown by 95%, while overall organic acreage in Ontario has grown by 150%. This report gives an overview of the geographic make-up of Ontario organic, as well as the types of organic production and gross farm receipts by farm type.
Ontario Organic in Canadian Context
How does Ontario’s organic production compare to the rest of Canada? This report will look at Ontario's organic producers, processors, and acreage and how we have compared to the other provinces over time from 2012-2022.
Further Reading
The Canada Organic Trade Association (COTA) produces valuable market and production data reports for the Canadian organic industry. Their annual By the Numbers report provides information about organic acreage and operators across the country. COTA also produces specialized reports, including the Canadian Organic Market Report, Canadian Organic Food Processing Report, and Prairie Organic Production Report.
The World of Organic Agriculture, published by the Research Institute of Organic Agriculture (FiBL) and IFOAM – Organics International, provides a comprehensive review of recent developments in global organic agriculture. It includes contributions from representatives of the organic sector around the world and presents detailed organic farming statistics that cover the area under organic management, specific information about land use in organic systems, the number of farms and other operator types, and selected market data.
The Census of Agriculture is conducted every 5 years by Statistics Canada. 2016 farm and farm operator data is available through Statistics Canada, however most information is not able to be filtered for organic in their online catalog. Some data in this portal has been sourced from the Census of Agriculture.
Documents
In Ontario, there are some resources to find organic pricing for crops and other commodities, but very little market data on organic and other premium meat products. This study conducted by the Organic Council of Ontario analyzes prices, marketability, consumer awareness and demand for various premium meat labels.